2017 - 2019
Devices with interactive multi touch surfaces are ubiquitous and are getting more and more sophisticated in terms of providing experiences, that thanks to ultra low latencies and carefully tuned prediction algorithms are smooth and have a natural feel to them. But the digital world lacks physicality and neglects the human sense of touch and does not make use of the fine motor skills of the human hands that allow for high precision tasks and complex manipulation. Also the human capability of bi-manualism and spacial multiplexing is often not exploited.
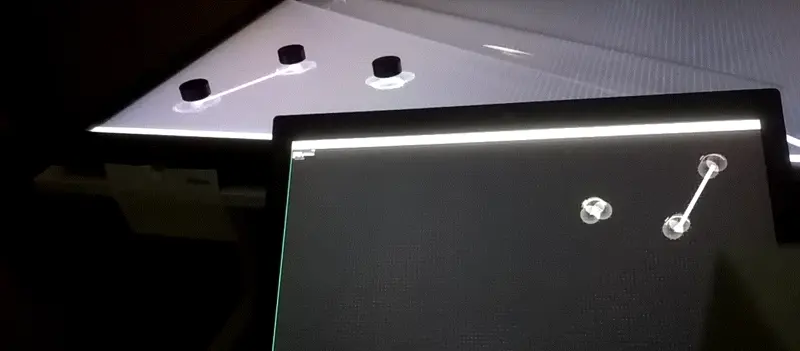
Tangible user interfaces are an interface type that interlinks the the digital and physical worlds, and allows for exploration of digital content through manipulation of physical objects.Tangibles are not mere input devicesbut they can superimpose elements of the graphical user interface or become fully fused with it. In other words: they are - part of the interface brought to life. The goal of this project was to explore tangible objects as control elements, categorise them by comparing them to input devices and peripherals, analyse them in terms of affordances, and define scenarios, where they could be of use. All this while referring to scientific studies evaluating the performance of tangible user interfaces. This work resulted in a prototype that aims to explore, how tangible control elements could help to navigate through a complex data set, while enhancing the users experience.
First prototype


Weather Data Visualization
Interactive Meterological Data Visualization
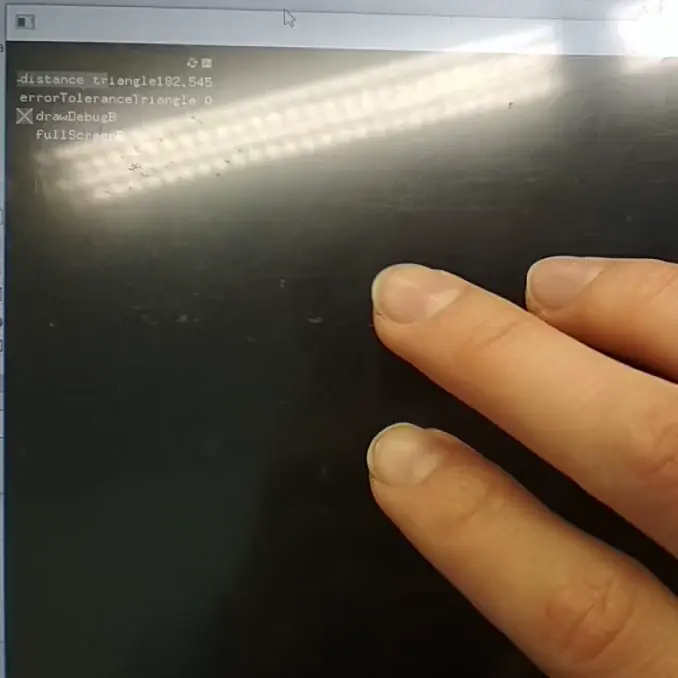
Linear data representations are more common than polar graphs, for good reasons. It's way easier to compare the deltas of outliers and see trends unfold. Because we read from left to right (in some languages from right to left) a cartesian representation of values is more intuitive while a polar representation requires the onlooker to make an additional step of mental decoding. However a dataset, that describes natural cyclic activity, a polar representation might grant the onlooker with new perspective and a new mental model. One such example is meterological data visualised in one-year intervals. A year is a cyclic process made up of recurring sub-cyles.
The resulting visualisations show temperature and global radiation (intensity of sun rays hitting the earth's surface at the measuring station). The data was provided by the [Solar Institute in Jülich](https://www.fh-aachen.de/forschung/institute/sij/) and visualised.
2017
 May
May 2018
 November
Bachelor Thesis Prototype
Download Bachelor’s Thesis (PDF)
Trade Fair Demonstrators for Fraunhofer
During my Bachelor’s studies, I had the opportunity to work at Fraunhofer IPT in Aachen. Together with Hoc-Tin Trieu and the team at Fraunhofer, I developed several interactive trade fair demonstrators designed to communicate different use cases in industrial production chains. Since these chains typically involve a single workpiece undergoing multiple stages of manufacturing, I integrated this concept with the 3D-printed capacitive markers I had developed for my Bachelor’s thesis.
A key part of this work involved close collaboration with engineers from various departments. I spent a lot of time discussing their workflows and trying to understand what aspects of their processes they wanted to convey to visitors. These conversations directly informed the design of the demonstrators. The tangible interfaces we created turned out to be an ideal medium for industrial exhibitions, as they allowed us to represent both the digital and physical aspects of production in an engaging and accessible way.
Pilotline "Tooling"
This trade fair demonstrator presents a tooling production pipeline, outlining sequential steps in component fabrication. The display begins with additive manufacturing, specifically Laser Metal Deposition, followed by various subtractive processes like milling and EDM. Viewers can interact with physical models representing workpieces at different production stages. As these workpiece models are positioned along the chain, the displayed information dynamically adjusts to reflect the corresponding manufacturing phase. This interactive element allows for direct exploration of how specific operations contribute to the overall production flow. The demonstration illustrates the integration of diverse manufacturing techniques, from initial material build-up to final surface treatment. It provides a functional overview of the coordinated processes involved in creating advanced tools.


Process Chain Blisk manufacturing
This interactive demonstrator illustrates the complex manufacturing sequence for engine blisks, critical components in aircraft engines. It outlines a multi-stage production chain, beginning with initial material shaping and progressing through various machining operations. Attendees can place physical blisk models, representing different stages of completion, onto the exhibit’s designated positions. When a model is moved, the display immediately updates to detail the specific manufacturing processes, tools, and parameters relevant to that stage. This feature offers a practical understanding of how precision machining, surface treatment, and inspection are integrated. The demonstration highlights the iterative refinement required to achieve the exacting tolerances of these high-performance parts. It effectively conveys the coordinated steps involved in transforming raw material into a finished engine blisk.


Process Chain Gear Manufacturing
This exhibit showcases the detailed “PROCESS CHAINS FOR GEAR MANUFACTURING,” specifically highlighting techniques relevant to producing gears for heavy-duty applications like those at Scania. The demonstrator outlines key stages such as Gear Shaping, Gear Shaving, and the critical Process of Case Hardening. When different physical gear models, representing their respective production stages, are placed on the multi-touch table, the display dynamically updates. This interaction provides immediate visual and textual information about the unique characteristics and parameters of that specific manufacturing step. The demonstrator also touches upon potential “Gear Deviations,” illustrating how meticulous process control is essential. This hands-on approach allows for a direct understanding of the precision and complexity inherent in fabricating robust gears. It serves to convey the comprehensive journey from raw material to a finished, high-performance gear.